
Past Human Population Growth
In previous lectures, we have described how human cultural development was closely tied to changes in the natural environment. Successive cultural revolutions, such as the agricultural revolution, have led to surges in population. Figure 1 summarizes again the historical record, typical of a “J-shaped” growth, with humans filling new niches and (perhaps) not yet reaching a limiting carrying capacity. One feature to note in this plot is the lack of huge fluctuations associated with famines or wars. In fact, the nature of J-shaped (exponential) growth is such that episodic reductions due to such catastrophes usually do not affect the inexorable and overpowering upward acceleration in population size. An exception is the period of the “black death” in Europe, which produced a noticeable but small downward spike in the curve. The wholesale loss of life due to world wars of the 20th century produced only small perturbations to the upward trend.
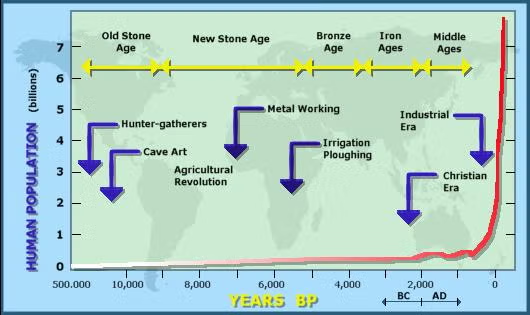
Figure 1: Human Population Growth over Time
The human population growth of the last century has been truly phenomenal. It required only 40 years after 1950 for the population to double from 2.5 billion to 5 billion. This doubling time is less than the average human lifetime. The world population passed 6 billion just before the end of the 20th century. Present estimates are for the population to reach 8-12 billion before the end of the 21st century. During each lecture hour, more than 10,000 new people enter the world, a rate of ~3 per second!
Of the 6 billion people, about half live in poverty and at least one fifth are severely undernourished. The rest live out their lives in comparative comfort and health.
The factors affecting global human population are very simple. They are fertility, mortality, initial population, and time. The current growth rate of ~1.3% per year is smaller than the peak which occurred a few decades ago (~2.1% per year in 1965-1970), but since this rate acts on a much larger population base, the absolute number of new people per year (~90 million) is at an all time high. The stabilization of population will require a reduction in fertility globally. In the most optimistic view, this will take some time.

Fertility
The current growth of population is driven by fertility. Figure 2 shows how total fertility rate is a strong function of region. It can be readily seen that the more developed countries (“the North”) have lower fertility rates than the less developed countries (“the South”). The fertility rates in the developed world are close to replacement levels (i.e., the population is roughly stable), while the rates in the developing world are much higher. Thus, population growth and level of development are clearly linked.
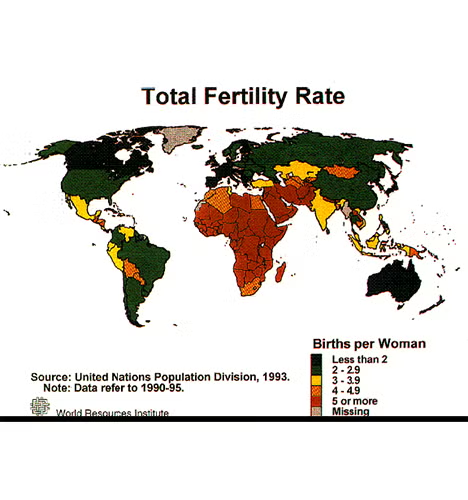
Figure 2: Global Total Fertility Rates, 1990-1995
Fertility is largely controlled by economics and by human aspirations. The high fertility of the developing world can be partially explained by the large number of hands needed to perform low-technology agricultural tasks. In these areas, families with large numbers of children realize an enhanced economic status. As technology improves, parents realize that having more children decreases rather than increases their standard of living. A dramatic example of this effect occurred in Thailand, where, as soon as parents realized that future economic status was linked to the secondary schooling (which is expensive in Thailand), the fertility rate dropped from about 6 to 2 in a decade!
Population-Age Pyramids
While fertility rates are obviously useful, the demographics of the existing population are also important and can provide key information to predict future growth rates. An example of two such population-age pyramids is shown in Figure 3.
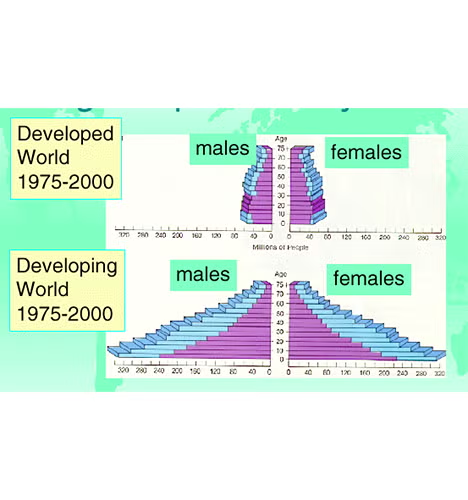
Figure 3: Population/Age Pyramids of the Developed and Developing World
The top figure shows the population-age pyramid for the developed world and the bottom figure is for the developing world. The figure illustrates the pyramids for the years 1975 (pink) and 2000 (blue). The population/age structure of the developed world represents that of a stable (or nearly stable) population. Here, the pyramid is more rectangular than for a rapidly growing population (bottom) where there is a much larger number of young people. The bottom figure (typical for countries like Mexico, Malaysia, India, etc.) is more triangular and shows how a rapidly growing population is dominated by young people. The female side of the diagram is particularly important in understanding future growth. This is because fertility is largely controlled by the number of females in their reproductive years (roughly ages 15 – 40).
In the developing world, not only are there many females capable of reproduction, but there are many more young females who are of potential mothers. Thus, the shape of the population-age pyramid for the developing world indicates that the population will continue to grow aggressively for the near future as the cohort of fertile females gets larger each year, fed from the lower parts of the pyramid. It takes many tens (perhaps hundreds) of years to steepen the slopes of the population-age pyramid. Such a steepening is essential before populations can become stable. Intensive efforts to control population have been implemented in various countries. In China, aggressive population control via a one-child family policy is bringing remarkable change to age structure and population size. Click here for a short case study and dynamic graphic representation of China’s future population and food security.
As can be seen, the aggressive population planning policies in India (discussed further in the next lecture) have served to steepen the pyramid – but only marginally so. The pyramid for 1991 has a long way to go before it resembles the stable structure seen in the developed world.
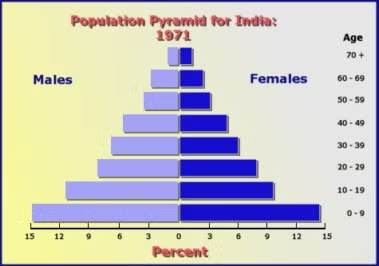 | 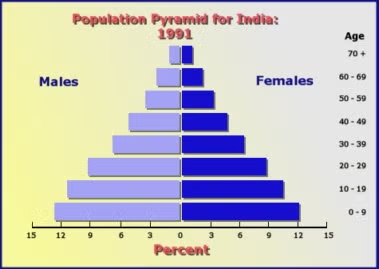 |
| Figure 4: Comparitive Population Pyramids for India | |
Clearly, population control is a challenging task for which both persistence and patience will be needed.
Mortality
Mortality, or the death rate per individual, is another determining factor of population growth. In the developing world, the death rate has dropped, more or less continuously, since the start of the industrial revolution. The following figure shows the slow, hard won, reduction in death rate in various European countries. Personal hygiene and improved methods of sanitation have played a major role and preceded the impact of modern medicine and, in particular, the development of antibiotics capable of reducing death due to infection. The downward trend of the death rate is common to most countries, although there are some countries (for example, Russia) where the death rate remains high and refuses to move appreciably.
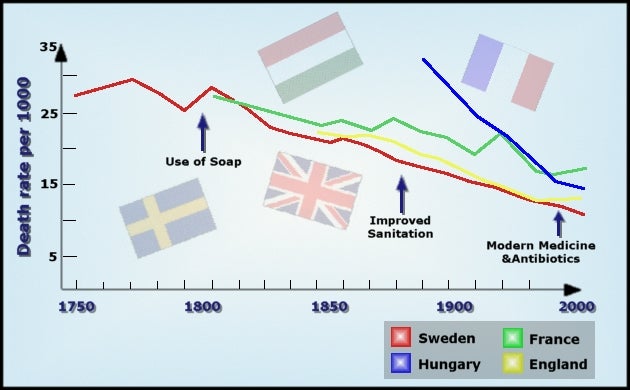
Figure 5: Death Rates per 1000 over Time
The combination of decreasing death rate due to the march of progress in sanitation and medicine, coupled with the decrease in birth rate due to changes in the economies, has led to a profound change in the population growth curve in the developed world. This change is called the Demographic Transition.
The Demographic Transition
This is the name given to the process that has occurred during the past century, leading to a stabilization of population growth in the more highly developed countries. The Demographic Transition is shown schematically in Figure 6. It is generally characterized as having four separate phases or stages.
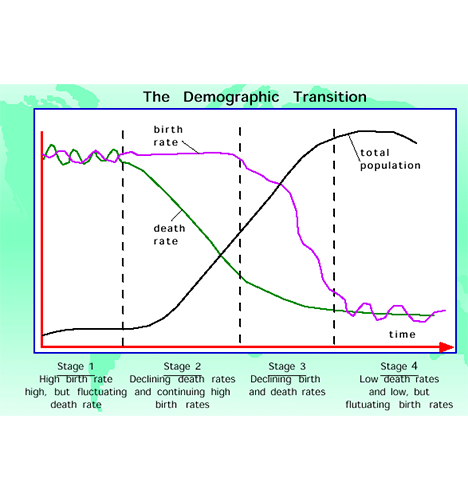
Figure 6: The Demographic Transition
Stage 1. In this early stage of the demographic transition in Europe, birth rates and death rates are both high. Modern medicine had not yet developed techniques to lengthen life substantially and standards of personal hygiene were comparatively low. Both rates fluctuated depending on circumstances.No demographic transition has occured.
Stage 2. In this stage, standards of hygiene and more modern medical techniques began to drive the death rate down, leading to a significant upward trend in population size. The birth rate remained high, as much of the economy was based on agriculture. Mexico is currently between this and the following stage.Stage 2 and 3 are indicative of a partial or first demographic transition.
Stage 3. Urbanization decreases the economic incentives for large families. The cost of supporting an urban family grew and parents were more actively discouraged from having large families. In response to these economic pressures, the birth rate started to drop, ultimately coming close to the death rate. In the meantime, however, the increased population in Europe led to tremendous societal pressures that caused large scale migration (e.g., to the USA) and extensive global colonialization.
Stage 4. The last stage of the demographic transition in Europe was characterized by a higher, but stable, population size. Birth and death rates were both relatively low and the standard of living became much higher than during the earlier periods. The developed world remains in the fourth stage of its demographic transition. A good example of a country in this stage is Sweden. At stage 4, we speak of countries having completed the second or a full demographic transition.
The demographic transition did not occur overnight in Europe. It is anticipated that a transition like this will occur in all countries as they become further developed. However, time (many decades) will be needed for the birth and death rates to equilibrate – during which time the population will continue to grow rapidly.
The demographic data from the various countries of the world has been analyzed by many separate entities, including the United Nations. Figure 7 shows the expected future growth curve. Most of the future growth will occur in the developing world as each country struggles to go through a demographic transition of their own. This particular projection shows a total population approaching 9 billion by the year 2050. The projected curve more closely resembles a sigmoidal (logistic) or “S-shaped” curve.
Click on image to enlarge
Figure 7: Projected World Population Growth
Because most developed countries have undergone a complete demographic transition, and have low population growth rate, their numbers increase little over the present. In contrast, developing countries with their high population growth rate will comprise a larger and larger fraction of the world populations.
Future Global Population Growth
Anyone who examines world population growth over the past two centuries certainly must be astounded, and quite possibly alarmed. The global population reached one billion in 1804. In 1927, some 123 years later, it passed two billion. Sixty years later, in 1987, the world population was five billion, and 12 years later, in October 1999, it is estimated to have passed six billion. Small wonder that many are concerned about what this bodes for our future. Due to the momentum represented by steeply pyramidal age distributions, population growth surely will continue for one to several generations. Most of that growth will occur in developing nations. An eventual world population of 8-12 billion is expected by the end of the century. But estimates change frequently.
According to a report from the United Nations Population Fund, based on 1998 analyses (see The State of World Population 1999), projections for the future global population are being revised downward. The projection for 2050 now is 8.9 billion (medium variant), substantially lower than the 1996 projection of 9.4 billion.
The major reason for the lower projection is good news: global fertility rates have declined more rapidly than expected, as health care, including reproductive health, has improved faster than anticipated, and men and women have chosen to have smaller families. About one-third of the reduction in long-range population projections, however, is due to increasing mortality rates in sub-Saharan Africa and parts of the Indian subcontinent. The most important factor is HIV/AIDS, which is spreading much faster than previously anticipated.
The HIV/AIDS epidemic is having a devastating effect on Africa. Estimates released in 1998 by UNAIDS and the World Health Organization indicate that global HIV infections increased 10 per cent in 1998 to 33.4 million people worldwide. In 1999 alone, an estimated 5.8 million people contracted the virus that causes AIDS. Fig. 8 shows the likely impact of AIDS in Sub-Saharan Africa, comparing population projections with and without AIDS in the 29 most-affected countries, 1980-2050.
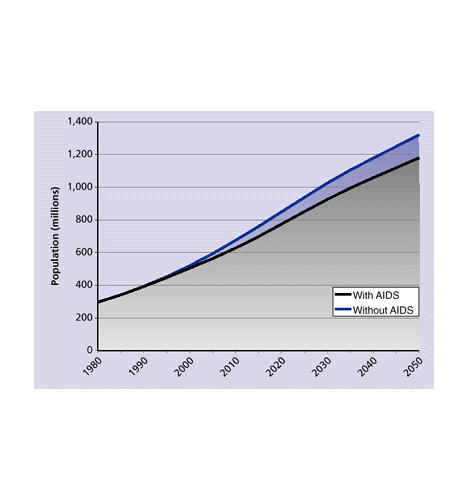 Figure 8. Figure 8. |
Changing Distribution of World Population
Populations in certain regions will grow; elsewhere, human numbers will stabilize or even decline. Within countries, populations will continue to shift from rural to urban areas, while becoming increasingly older and better educated. Migration between countries will be an increasingly important factor in international relations and the composition of national populations.
Fig 7 shows the regional make-up of the world population, 1950-2050. Clearly, the fraction that lives in less-developed regions will dominate, continuing a trend that already is well underway. In 1960, 70 per cent of the global population lived in less-developed regions. By late 1999, the less-developed regions had grown to comprise 80 per cent. Of the projected growth of the world population by 2025, 98 per cent will occur in these regions.
Africa, with an average fertility rate exceeding five children per woman during the entire period, has grown the fastest among regions. There are almost three times as many Africans alive today (767 million) as there were in 1960. Asia, by far the most populous region, has more than doubled in size (to over 3.6 billion), as has Latin America and the Caribbean. In contrast, the population of Northern America has grown by only 50 per cent, and Europe’s has increased by only 20 per cent and is now roughly stable.
A global trend towards urbanization also is taking place. The world’s urban population is growing by 60 million a year, about three times the increase in the rural population (Fig. 9). 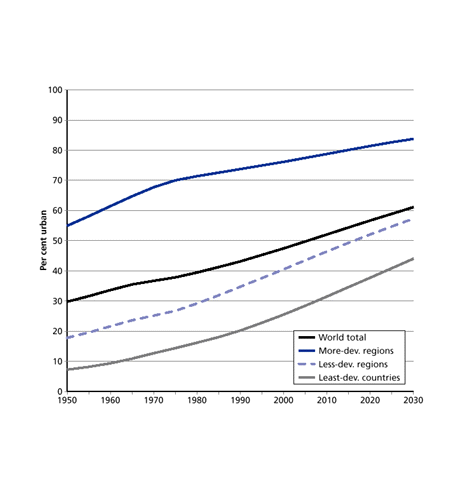 The movement of people towards cities has accelerated in the past 40 years, particularly in the less-developed regions, and the share of the global population living in urban areas has increased from one third in 1960 to 47 per cent (2.8 billion people) in 1999. Increasing urbanization results about equally from births in urban areas and from the continued movement of people from rural regions. By 2030, it is expected that nearly 5 billion (61 per cent) of the world’s 8.1 billion people will live in cities. (see Lecture on Migration and Urbanization)
Globally, the number of cities with 10 million or more inhabitants is increasing rapidly, and most of these new “megacities” are in the less-developed regions. In 1960, only New York and Tokyo had more than 10 million people. By 1999, the number of megacities was 17, 13 in less-developed regions. It is projected that there will be 26 megacities by 2015, 22 in less-developed regions (18 will be in Asia); more than 10 per cent of the world’s population will live in these cities, up from just 1.7 per cent in megacities in 1950.
Is there a Carrying Capacity for Homo sapiens?
As we have seen, the human population growth curve is currently following an exponential curve or a “J-shape” (fig. 1). Common sense tells us that such growth cannot continue – otherwise within a few hundred years every square foot of the Earth’s surface would be taken up by a human. Furthermore, experience with other species tells us that, ultimately, resource limitations and/or habitat degradation will force the human population curves to approach an upper limit or asymptote – the carrying capacity, often symbolized as ” K” by ecologists. It is very natural to ask the linked questions – does humanity have a carrying capacity and, if so, what is it – and when will we reach or overshoot this limit?
Joel Cohen’s recent book on human carrying capacity summarizes the continuing lack of scientific consensus on the subject. Estimates of the number still vary widely according to the specific assumptions used. In fact, the estimates are more scattered than before – indicating a quantitative field still very much in its infancy. One strand of thought, represented by the author Julian Simon discards the notion of a human carrying capacity altogether, claiming that the additional people will provide sufficient creativity and innovation to break through any possible natural barriers to human population growth. Most of the serious estimates of K for humans, however, lie in the range 10 -20 billion people.
There are no easy answers to the questions: “How many people can the earth support?”, and “At what level of well-being?”. Cohen suggests we think in terms of three possible (and non-exclusive) solutions:
- Make a bigger pie: Increase human productive capacities through technology and innovation
- Put fewer forks on the table: Reduce numbers and expectations of people through such means as family planning and vegetarian diets
- Teach better manners: Change the terms of people’s interactions through improved planning and government to enhance social justice.
Summary
- Human population exhibits an J-shaped growth curve, and is accelerating.
- Age pyramids are important descriptors of a population’s recent history and medium-term future. Population growth rates are highly dependent upon level of development.
- A decline in both death and birth rates is referred to as a complete demographic transition.
- Most current and future growth is taking place in developing countries, which have experienced only a partial demographic transition.
Suggested Readings
- Cohen, J. 1995. How many people can the earth support? W. W. Norton & Co., New York
- Ehrlich, P. and Erhlich, A. 1990. The Population Explosion. New York: Simon and Schuster.
- Gallant, R. 1990. The Peopling of the Planet Earth. New York: Macmillian Publishing Company.
- Gore, A. 1992. Earth in the Balance. New York: Houghton Mifflin Company.
Web Resources
- Visit a useful site on the world population at six billion.
- The U.S. Census Bureau Web Page has statistics on current birth and death rates, as well as population-age pyramids for all countries.
- Zero-Population Growth (ZPG), a nonprofit organization working on population issues. Of special interest is the ZPG Congressional Report Card