Systems Thinking: Population & Biodiversity
Linking Population, Gender, and Biodiversity
Objective
Modern science has been heavily influenced by 18th century reductionist thinking, emphasizing the ability to understand the whole in a “machine-like” or mechanistic way by a detailed understanding its parts. As scholars of Global Change, the events we study on a day-to-day basis are inevitably outgrowths of complex interactions within geological, biological, and social systems, or combinations thereof – hence a systems thinking approach.
| Mechanistic Thinking | Systemic Thinking |
| Parts | Wholes |
| Objects | Relationships |
| Events | Structures |
| Isolation | Interdependence |
| Specificity | Generality |
| Simplicity | Complexity |
Table 1: Mechanistic thinking versus systemic thinking
In this activity, you will be introduced to the idea that by developing a deeper understanding about the underlying structure of global social and environmental problems (i.e., by taking a systems perspective), we can begin to intervene strategically to influence the system as a whole to solve global problems.
Before Coming to Class
First, read the Introduction to Systems Thinking, http://www.systems-thinking.org/intst/int.htm, and New York City Garbage Example portions of the lab. Then, read an article by the WorldWatch Institute entitled Linking Population, Women and Biodiversity (Chapter 3 State of the World 2003, p. 38-61). This article explores the linkages between population, women and biodiversity, as well as examining gender inequality. Lastly, the article discusses ways to empower women, which has important implications for both population and biodiversity.
While reading the article, take note of cause and effect relationships postulated by the authors throughout the paper. Think about these in the context of systems thinking and causal loop diagrams. In class, we will use this article to create causal loop diagrams to investigate the relationships between society and environment.
Introduction to Systems Thinking – What is a System?
- “An interconnected set of elements that is coherently organized around some purpose” – Dana Meadows
- “Integrated wholes whose properties cannot be reduced to those of smaller units” – Fritjof Capra
- “A system is an entity which maintains its existence through the mutual interaction of its parts.” – Gene Bellinger
What is Systems Thinking?
- “Seeing interconnectedness and relationships, the whole picture as well as the component parts” – Gunter Ossimitz
- “A discipline for seeing wholes…a framework for seeing interrelationships rather than things, for seeing patterns rather than static snapshots” – Peter Senge
- “The key emphasis here is one of “mutual interaction,” in that something is occurring between the parts, over time, which maintains the system.” – Gene Bellinger
Systems thinking is a recent phenomenon in science emphasizing deeper understanding, interconnectedness and dependence of parts of the systems as opposed to the Cartesian way of looking at distinct parts to understand the whole. Systems thinking allows us to understand how systemic structures lead to patterns and events. For example an increase in atmospheric CO2 concentration (systemic structure) from fossil fuel combustion may give us a pattern of increased global temperatures (pattern). This in turn may alter events and cause sea-level rise or increased severe weather (event).
How is Systems Thinking Useful?
- Helps capture complex systems and relationships that are hard to keep track of and understand.
- From the mutual interaction of the parts of a system there arise characteristics, which cannot be found as characteristic of any of the individual parts. Systems thinking facilitates understanding of these emergent properties.
- Gives us a basis for quantifying and decision-making.
- Allows us to think about solutions via leverage points or changing flows/variables.
New York City Garbage Example
To better understand what we mean by systems thinking let’s use the garbage sanitation system in New York as an example system (from “Systems Thinking”, Peter Senge & Raju Mandhyan). This system contains a Population (P), Garbage (G), Bacteria (B), Disease (D), Sanitation Facilities (S), Modernization (M) and City Migration (C). Look at the green loop (Figure 1).
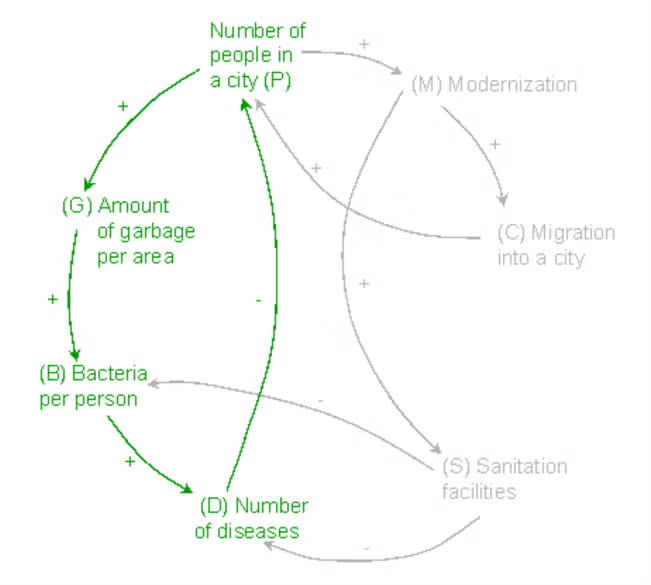
Figure 1: Green loop of NYC garbage systems thinking diagram
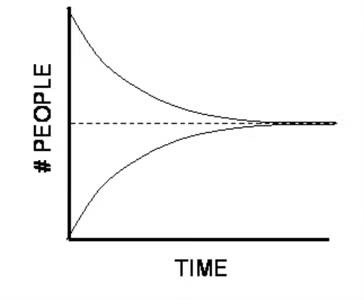
Figure 2: Population dynamics of a balancing loop
It is often useful in systems thinking to talk yourself through the system. First choose a direction (increase or decrease) and a logical starting point for the green loop. Population (P) is a good place to start.
- If the number of people (P) in a city increases then the amount of garbage (G) they produce will increase. Therefore this arrow has a + associated with it. (This would also be the case if you chose for initial population to decrease.)
- As the amount of garbage (G) increases, the amount of bacteria (B) per person also increases. Thus, this section of the loop also has a + sign associated with it.
- As the amount of Bacteria (B) increases, the number of diseases (D) will increase. Again, a positive relationship.
- As the number of diseases (D) increases, the number of people dying from disease will increase and this will decrease the population. This relationship is opposite or negative (increase in disease = decrease in population) thus, a – sign is associated with it.
- To determine a balancing loop from a reinforcing loop, count the number of minus signs around the loop. If there is an even number, or zero, minus signs then it is a reinforcing loop. If there is an odd number of minus-signs then it is a balancing loop.
- By counting up the number of minus signs in this loop, we determine that there are an odd number of minus signs (1). Therefore, this must be a balancing loop. A balancing loop is one in which action attempts to bring two things to balance. Any situation where one attempts to solve a problem or achieve an objective is representative of a balancing loop. A balancing loop – moves toward a goal such as moving toward a carrying capacity (Figure 2).
Let’s look at another loop using the NYC garbage. First choose a direction and a logical starting point for the pink loop (Figure 3).
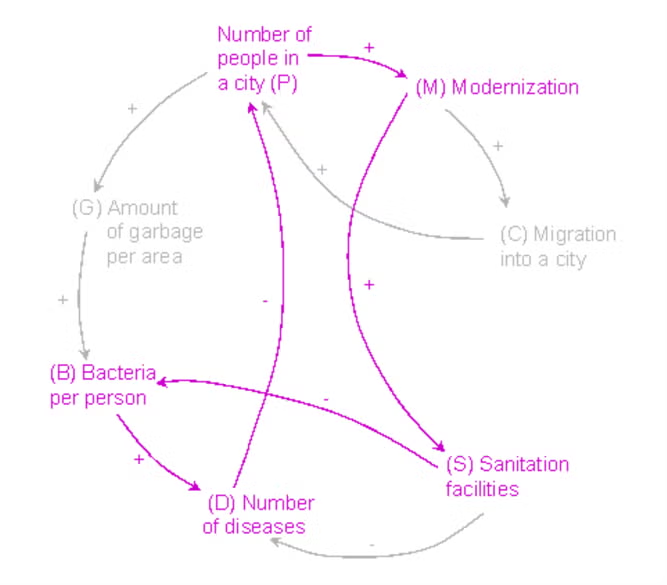
Figure 3: Pink loop of NYC garbage systems thinking diagram
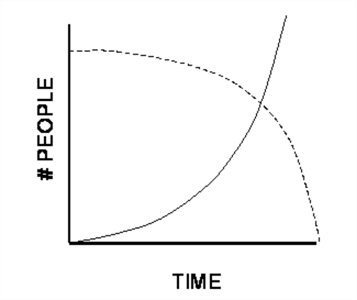
Figure 4: Population dynamics of a reinforcing loop – exponential growth or decline
- If the number of people (P) in NY City increases then modernization (M) of the city will also increase. Therefore this arrow has a + associated with it.
- As modernization (M) increases, the sanitation facilities (S) will also increase. Thus, this section of the loop also has a + sign associated with it.
- As sanitation (S) increases, the number of bacteria (B) will decrease. Therefore, this part of the loop has a negative relationship.
- As the number of bacteria (B) decreases, the number of diseases (D) will also decrease. This is where systems thinking becomes complicated. Although the numbers of diseases are decreasing your relationship between bacteria and disease is positive. More bacteria = more disease or less bacteria = less disease. Both of these relationships go in the same direction so the relationship is positive.
- When the number of diseases (D) decreases, people dying from disease will also decrease and this will increase the population. This relationship is negative thus, a – sign is associated with it.
- By counting up the number of minus signs in this loop, we determine that there is an even number of minus signs (2). Therefore, this must be a reinforcing loop. A reinforcing loop is one in which the interactions are such that each action adds to the other. Any situation where action produces a result, which promotes more of the same action, is representative of a reinforcing loop. A reinforcing loop –reinforces change with even more change; leads to exponential growth or decline (Figure 4).
Now that you are familiar with both the balancing and reinforcing loops, walk yourself through the other two loops in the system (Figure 5 and Figure 6). What kind of loops are they?
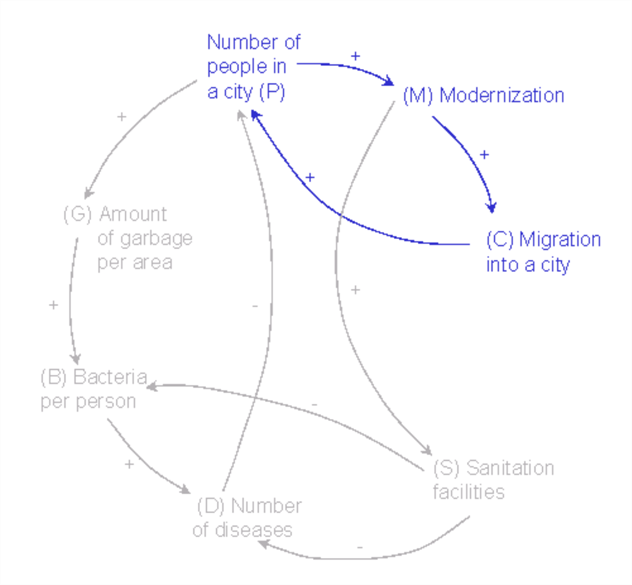
Figure 5: Blue loop of NYC garbage systems thinking diagram
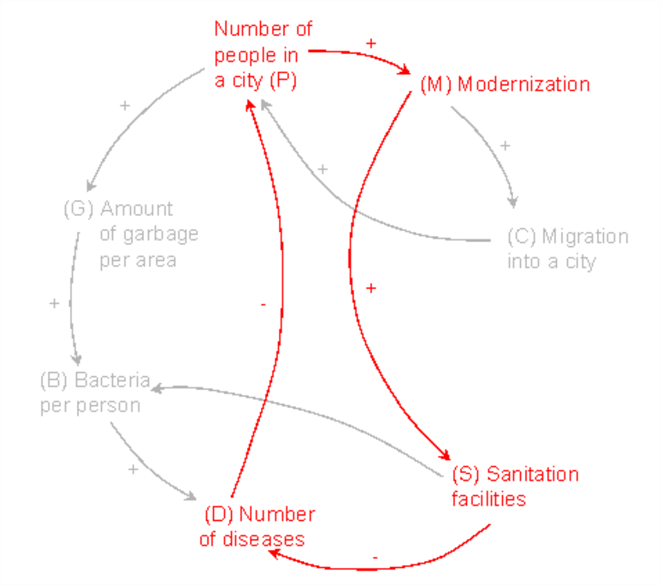
Figure 6: Red loop of NYC garbage systems thinking diagram
In Class Activity
- Team up in pairs and create two causal loops of 4 or more elements from the article Linking Population, Women and Biodiversity. Make sure that one loop is reinforcing and one is a balancing loop.
- Add (+) and (-) to the (S) and (O), and record your reasoning.
- Get together and explain loops to each other; decide on one reinforcing and one balancing loop and draw it on a board or piece of paper.
- Each group will present their two loops to the class.
After Class
Choose one of the following discussion questions and write half to a full, single-spaced page response using supporting examples and careful thought. Submit this assignment on Canvas.
Questions for Discussion
Once the students have presented their causal loop diagrams to the class, discuss the connections between population, gender and biodiversity. Use the following questions to guide the discussion.
Question 1
What are some of the differences between the causes of the transformation of Earth’s natural systems in developing and industrialized countries?
Question 2
What are some intervention points in the gender inequality, population growth and declining natural resources spiral?
Question 3
What benefits does female empowerment provide?
Question 4
What benefits does an environment with rich biological diversity provide?
Question 5
How is the population growth of the United States different to that of other industrialized nations? What consequences might this have for resource consumption?
Question 6
What is a biological hotspot? What problems have arisen in many hotspots around the world? What is causing these problems?
Question 7
What role does urban population growth and urbanization play in ecological decline? How is gender related to urbanization?
Question 8
How do world markets and exposure to the world trading system alter farming and put pressure on ecosystems?
Question 9
How can recognizing the important role of women in the working process improve land stewardship? Why is land ownership by women important? What are some barriers to these processes?
Question 10
What programs and policies could be implemented to improve gender inequality and protect biodiversity hotspots?
Question 11
What can you do in your life to improve biodiversity and gender equity?
Reading